


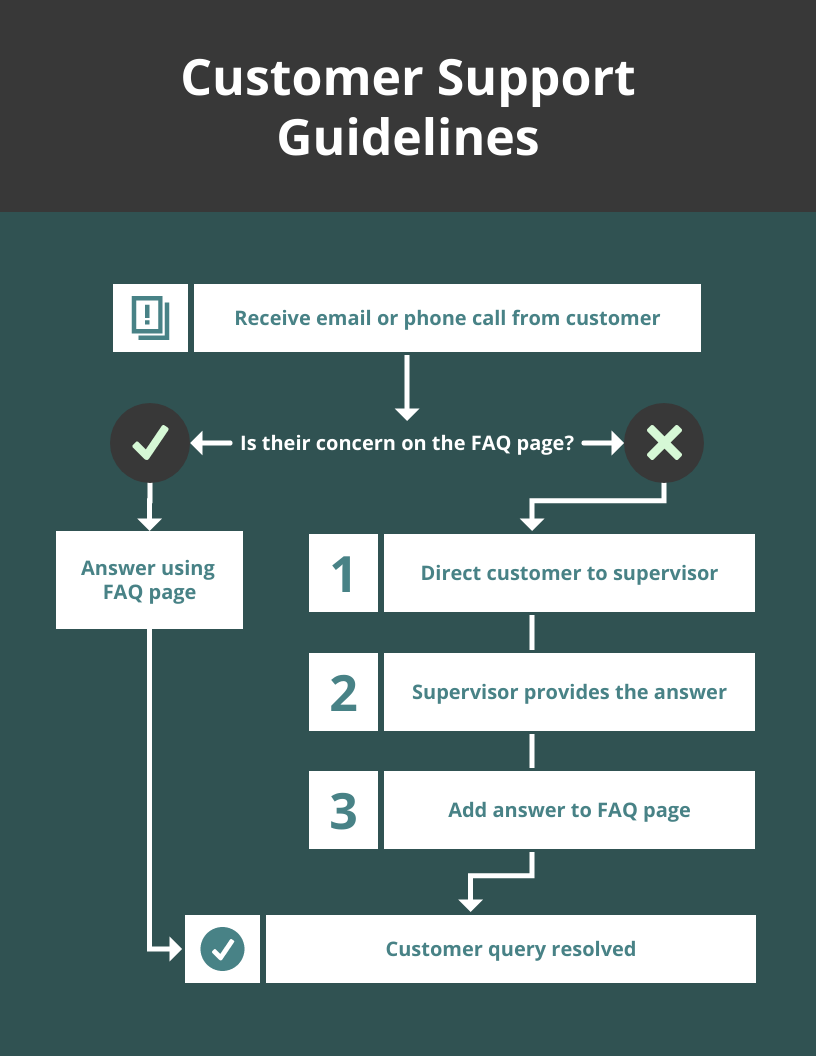
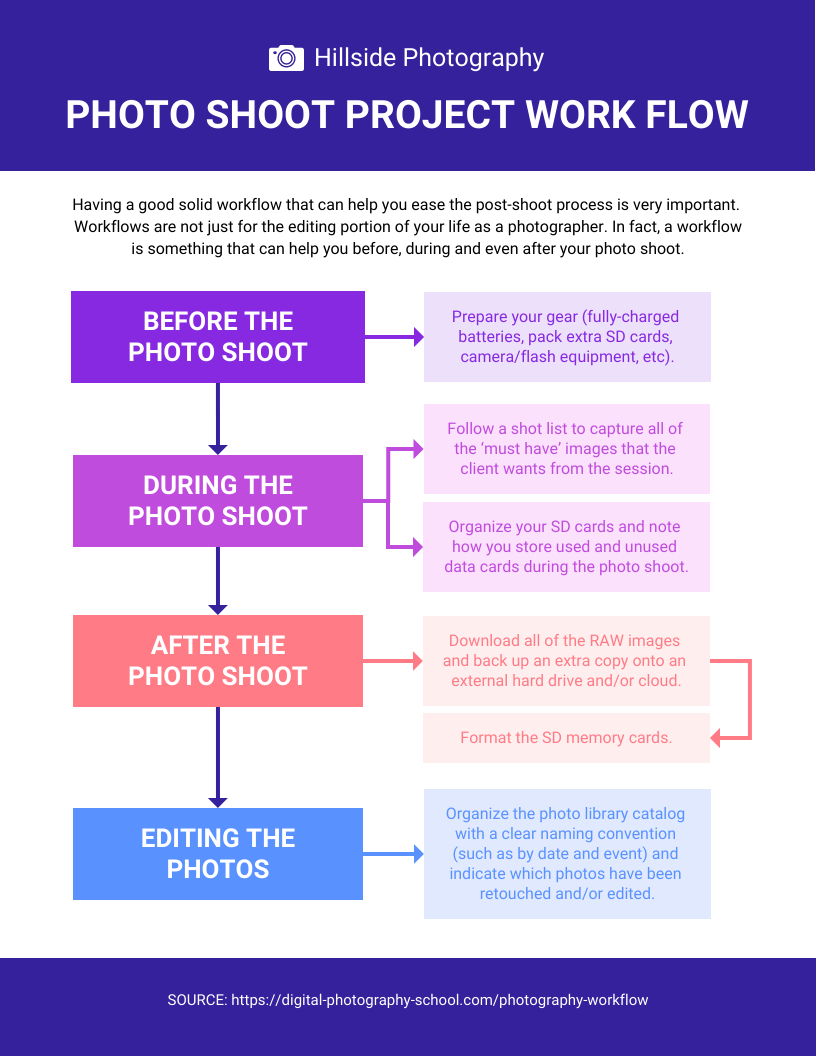
A flow chart example is commonly used to show the sequence of events within a system. They are very helpful in understanding processes that are too complex or convoluted to be explained with words alone. More importantly, they are good resources for learning how specific tasks work and how they interact with one another.
1) Use simple colors while creating a flow chart template.
Use only 2-3 colors especially if you have lots of different types of symbols which can make them confusing. You may also use gradients or patterns for indicating more complicated ideas but again keep it simple by sticking to solid color blocks wherever possible.

Venngage
2) Use boxes with rounded corners on your process flow diagram
This is because square corners look strange when you connect lines at their ends. Also, it is easier to draw curved lines between two round boxes than curved lines between two square boxes.
3) Use the drawing package that comes with your operating system.
You’ll probably find it doesn’t take long before you get used to it and start to write much faster when typing again. If you need something more powerful, consider using Microsoft Visio or OmniGraffle which are designed for creating flow charts and other diagrams.
4) Avoid using too many different styles of boxes in one flow diagram.
It makes the overall appearance less clear and can make symbols look too cluttered (too much like a set of Christmas lights). Also, avoid including any decoration on the outside of shapes because these can become distracting if they’re not relevant to each specific symbol within them. For example, you might want to use a circle for a start or end symbol but it’s not necessary to add a border around it.
5) Connect related boxes with lines in the process map
This will help the viewer follow the sequence of events more clearly and understand how the different parts of the system work together. It also makes your diagram look neater and less cluttered.
6) Label all boxes and lines.
Make sure you include a clear title and explanatory notes for your flow chart example so that people who are looking at it can understand what’s going on without having to guess. You might also want to use icons to indicate specific types of tasks or processes, but again make sure everything is legible and easy to understand.
7) Use a consistent layout throughout your diagram.
This will help to create a sense of unity and make it look neater. It’s also helpful if you need to print out your diagram for reference or for giving it to someone else.
Venngage
8) Take care when grouping related flowchart symbols together.
If you put too many things in one group, it can be difficult to see what’s going on. Try to use no more than 3 or 4 related symbols in any one area and keep them neatly aligned so that everything is easy to understand at a glance.
9) Use connectors sparingly.
Too many connectors can make your diagram look messy and confusing. Only use them when they’re really necessary to connect two boxes that are related to each other.
10) Use a different color or style of connector for each type of connection.
This will help to make the diagram more visually appealing and easy to follow. Again, use no more than 3 or 4 different colors or styles of the connector.
11) Test your flow chart on someone else.
It’s always a good idea to get someone else to take a look at your diagram and see if they can understand it without any problems. If not, go back and make some changes until everything is clear.
12) Use a software program to create your flow chart.
This is the best way to achieve professional results, especially if you need to create a complex diagram with lots of different symbols and connections. Visit websites like Venngage, which has a flow chart maker that offers a wide range of features that make it easy to create accurate and visually appealing flow charts.
13) Print out your flow chart for reference.
If you’re working on a complex project, it can be helpful to print out a copy of your diagram so that you can refer to it while you’re working. This will also help to prevent any mistakes from being made.
14) Use color effectively when creating your flow chart.
Color can be used to indicate different types of information, highlight specific parts of the diagram, or improve its overall appearance. Too much color can be distracting though, so keep things simple and avoid using more than two or three colors in one diagram.
15) Add arrows to indicate alternative paths.
This will help to make your flow chart example fuller and will allow readers to visualize alternative routes they could take instead of just the one set out in the main sequence of events. This is also helpful when working with complex systems which require several different sequences of actions to be carried out before a particular goal is reached.
Takeaway
Creating effective flow chart examples can be a challenge, but if you follow these tips you’ll be well on your way to producing diagrams that are easy to understand and visually appealing. Just make sure to test them out on someone else before you finalize them and print them out for reference.